The following double-bar graph illustrates the revenue for a company for the four quarters of the year for two different years. Use the graph to answer the question.  In what quarter was the revenue the greatest for 2010?
A. first quarter
B. fourth quarter
C. second quarter
D. third quarter
Answer: B
Mathematics
You might also like to view...
If the sequence is geometric, find the common ratio r. If the sequence is not geometric, say so. ,
,  ,
,  ,
, 
A. 
B. - 
C. 2
D. Not geometric
Mathematics
The graph shows the total sales in thousand of dollars from the distribution of x thousand catalogs. Find the average rate of change of sales with respect to the number of catalogs distributed for the change in x. 30 to 40
A. 
B. 0
C. 1
D. 
Mathematics
The polar equation of the graph is either r = a + b cos ? or r = a + b sin ?, a > 0, b > 0. Match the graph to one of the equations. 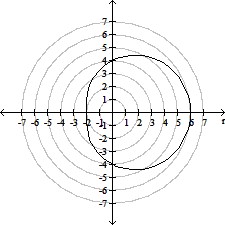
A. r = 2 + 4 cos ? B. r = 4 + 2 sin ? C. r = 2 + 4 sin ? D. r = 4 + 2 cos ?
Mathematics
Select the graph of the function: 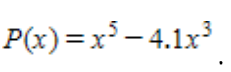
a. 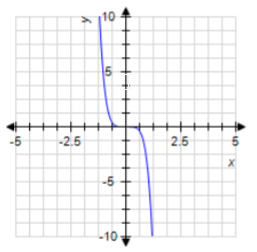
b. 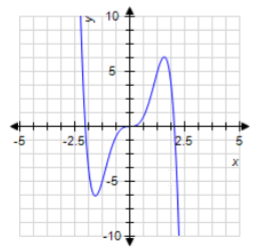
c. 
d. 
Mathematics