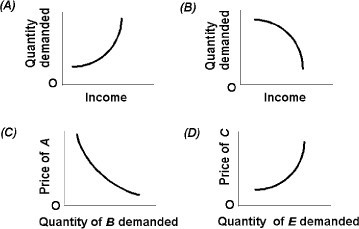
 Use the above figure. Which graph depicts an inferior good?
A. A
B. B
C. C
D. D
Answer: B
You might also like to view...
What is the fastest growing component of consumption in the United States?
A) new home construction B) services C) nondurable goods D) durable goods
What is the biggest problem of using government actions such as taxes and pollution charges to control external costs?
A) insufficient legal power to enforce the controls B) obtaining enough data to determine how much the tax or pollution charge will be C) In some situations, there is no known way to control the external costs. D) political lobbying and voter disagreement E) The Coase theorem points out that taxes and pollution charges work only in the short run and not in the long run.
The price elasticity of demand for a monopolist
A) is infinite since the monopolist is the only firm in the market. B) decreases as more competition occurs in the market. C) increases as similar products enter the market. D) is undefined due to the lack of competition.
Refer to the above data. How many units of the two products will the consumer purchase?
A) 3 of L and none of M B) 4 of L and 2 of M C) 3 of L and 5 of M D) 2 of L and 3 of M