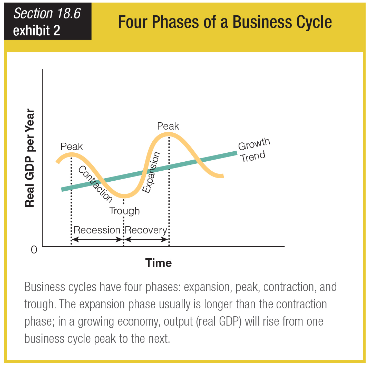
Suppose that you charted the rate of unemployment on the same graph. How would you expect the graph of unemployment to look in comparison?
a. It would be similar but shifted slightly to the right.
b. It would be inverted but shifted slightly to the right.
c. It would be similar but shifted slightly to the left.
d. It would be inverted but shifted slightly to the left.
b. It would be inverted but shifted slightly to the right.
You might also like to view...
In the presence of compensating wage differentials, explain why the consumption possibility frontier is not a good approximation of the utility possibility frontier.
What will be an ideal response?
The reason a corporation has retained earnings is to
A) pay unemployment taxes. B) make investments that will increase the value of the stock. C) avoid the double taxation of corporate profits. D) be able to make unemployment payments.
With modern sector enrichment growth, inequality will
a. first rise and then fall. b. first fall and then rise. c. remain about the same. d. None of the above.
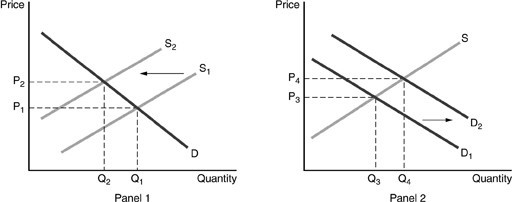 A shift from S1 to S2 reflects the change that happens when a negative externality is taken into account. A shift from D1 to D2 reflects the change that happens when a positive externality is taken into account.Refer to the above figures. An external cost exists. This will lead to a(n)
A. overproduction equal to Q1 minus Q2. B. underproduction equal to Q1 minus Q2. C. overproduction equal to Q4 minus Q3. D. underproduction equal to Q4 minus Q3.