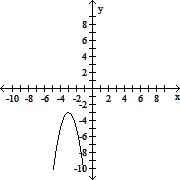
Use the graph of the function f(x) to locate the local extrema and identify the intervals where the function is concave up and concave down.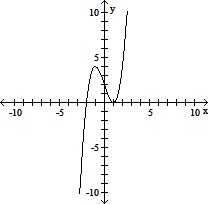
A. Local minimum at x = +1; local maximum at x = -1; concave down on (0, ?); concave up on (-?, 0)
B. Local minimum at x = +1; local maximum at x = -1; concave up on (0, ?); concave down on (-?, 0)
C. Local minimum at x = +1; local maximum at x = -1; concave up on (-?, ?)
D. Local minimum at x = +1; local maximum at x = -1; concave down on (-?, ?)
Answer: B
You might also like to view...
Use synthetic division to divide.(6x3 - 29x2 + 21x - 4) ÷ (x - 4)
A. -6x2 + 4x + 1
B. 6x + 5
C.  x2 -
x2 -  x +
x + 
D. 6x2 - 5x + 1
Find the regression line for the data points. Round your answer to the nearest hundredth. xy405-910-1110-19?
A. 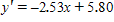
B. ?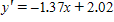
C. ?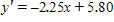
D. ?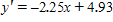
E. ?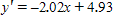
An experiment is conducted for which the sample space is  Decide if the given probability assignment is possible for this experiment. If the assignment is not possible, tell why.
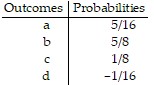
What will be an ideal response?
Match the quadratic function to the correct graph.y = 2(x + 3)2 - 3
A. 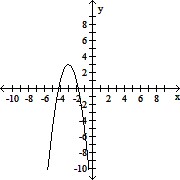
B. 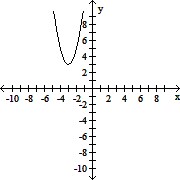
C. 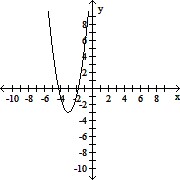
D.