The graphical device that illustrates the concept of scarce resources being efficiently utilized in the economy is a(n)
A. budget line.
B. indifference curve.
C. production possibilities frontier.
D. marginal cost curve.
Answer: C
You might also like to view...
Capital is a good used in the production of goods that households consume
Indicate whether the statement is true or false
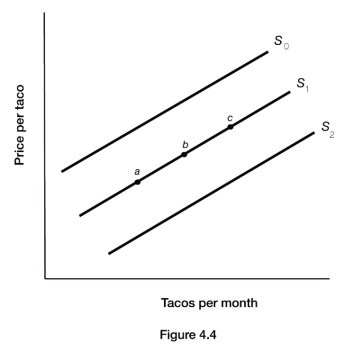 Figure 4.4 illustrates the supply of tacos. An increase in the number of Mexican food producers would most likely cause a movement from:
A. point a to point c. B. point c to point a. C. S2 to S0. D. S0 to S2.
Suppose that the percentage change in demand is 10%, the price elasticity of demand is 2, and the price elasticity of supply is 2. The equilibrium price will:
A. decrease by 2.5 percent. B. increase by 40 percent. C. increase by 2.5 percent. D. decrease by 40 percent.
If the average total cost is increasing over a given output range, the average total cost must be smaller than the marginal cost.
Answer the following statement true (T) or false (F)