Graphically, demand-pull inflation is shown as a:
A. rightward shift of the AD curve along an upsloping AS curve.
B. leftward shift of the AS curve along a downsloping AD curve.
C. leftward shift of the AS curve along an upsloping AD curve.
D. rightward shift of the AD curve along a downsloping AS curve.
A. rightward shift of the AD curve along an upsloping AS curve.
You might also like to view...
Use the figure below to answer the following question.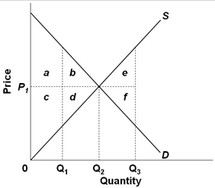 If actual production and consumption occur at Q1
A. there is deadweight loss of b + d. B. there is deadweight loss of e + d. C. economic surplus is maximized. D. consumer surplus is maximized.
If the growth rate of nominal GDP and the rate of inflation in an economy are 4% and 1% respectively, the growth rate of real GDP in the economy must be:
A) 4%. B) 1%. C) 3%. D) 5%.
It is likely that a constitutional amendment that required the government always to run a balanced budget would
a. contribute to a more stable level of output. b. mitigate the crowding-out effect. c. eliminate the economy's automatic stabilizers. d. All of the above are correct.
The components of M2 that are not also in M1:
A. sum to an amount that is smaller than the sum of the components of M1. B. are usable for making payments, but at a greater cost or inconvenience than currency or checks. C. are not usable for making payments. D. pay lower rates of interest than do the components of M1.