Solve the problem.Suppose 6 people sit at a circular table. Find the probability that 2 particular people are sitting next to each other.
A. .33
B. .1
C. .4
D. .2
Answer: C
You might also like to view...
The stack plot below shows the value of each of Danny's investments. The stack plot contains three regions. The uppermost unshaded region represents the value of Danny's investment in individual stocks. The center shaded region represents the value of Danny's investment in mutual funds and the bottom region in black represents the value of Danny's investment in a CD. The thickness of a region at a particular time tells you its value at that time.  Use the graph to answer the question.In which year was the total value of Danny's investments the least?
A. year 0 B. year 3 C. year 1 D. year 8
Find the cardinal number for the set.D = {x ? x ? N and 15 ? x ? 27}
A. n(D) = 42 B. n(D) = 11 C. n(D) = 13 D. n(D) = 43
Identify the degree of the polynomial.3t6 + 4t3 + 5 - 2t2
A. 3 B. 11 C. 6 D. 2
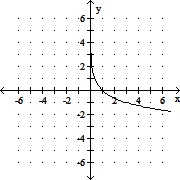
Match the function f with its graph.f(x) = log1/3 (x)
A. 
B. 
C. 
D.