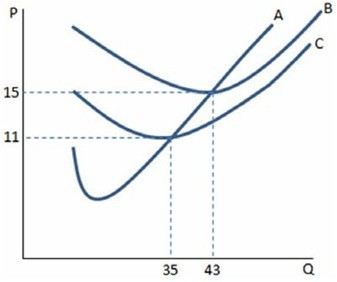
 Of the curves displayed in graph shown, what does curve C most likely represent?
A. Marginal cost
B. Average variable cost
C. Average total cost
D. Marginal revenue
Answer: B
You might also like to view...
Service sector outputs could be expected to increase in price less than industrial sector outputs as an economy grows.
Answer the following statement true (T) or false (F)
A current concern about Social Security is that
A) funds set aside by past generations to pay benefits for future generations are growing too rapidly and may trigger inflation. B) promised benefit payouts are growing more rapidly than likely sources of revenues, indicating a future inability to keep the system operating. C) continued political bickering between the president and Congress could lead to an end to any funding of the program. D) the payroll taxes used to fund the program are being eliminated as part of an effort to generate employment increases, thus leaving the program bankrupt.
Consider the market for portable air conditioners in equilibrium. When a heat wave strikes the equilibrium price
a. and quantity both decrease. b. and quantity both increase. c. increases, and the equilibrium quantity decreases. d. decreases, and the equilibrium quantity increases.
Which of the following correctly identifies the impact of the formation of the North American Free Trade Agreement (NAFTA) on Mexico?
A. Mexican exports of fruits and vegetables to the United States declined substantially. B. NAFTA allowed Mexico to better exploit its comparative advantage in such products as apparel and food crops. C. After Mexico joined NAFTA, the average wage rates for the unskilled workers declined. D. Mexico's import of financial services and high-tech equipment from the United States declined.