Refer to the figure below.________ inflation will eventually move the economy pictured in the diagram from short-run equilibrium at point ________ to long-run equilibrium at point ________, 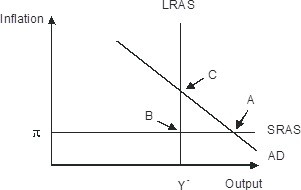
A. Rising; B; C
B. Falling; A; C
C. Falling; A; B
D. Rising; A; C
Answer: D
You might also like to view...
How do markets for insurance use no-claim bonuses to cope with private information?
What will be an ideal response?
According to the Fisher effect, if a lender and a borrower would agree on an interest rate of 8 percent when no inflation is expected, they should set a rate of _______ when an inflation rate of 3 percent is expected
a. 2 percent b. 5 percent c. 8 percent d. 11 percent
Suppose an increase in government spending stimulates real GDP without affecting the price level. What is the relevant range of the aggregate supply curve in this case?
a. The classical range. b. The intermediate range. c. The Keynesian range. d. The monetarist range.
Beef is a normal good. You observe that both the equilibrium price and quantity of beef have fallen over time. Which of the following explanations would be most consistent with this observation?
a. Consumers have experienced an increase in income, and beef-production technology has improved. b. The price of chicken has risen, and the price of steak sauce has fallen. c. New medical evidence has been released that indicates a negative correlation between a person's beef consumption and life expectancy. d. The demand curve for beef must be positively sloped.