Use the figure below to answer the following question.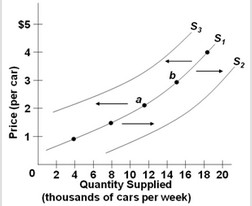 The diagram shows three supply curves for cars today. Which of the following would cause the supply of cars to shift from S1 to S2?
A. an increase in the price of cars in the market
B. a decrease in the number of car producers
C. expectations of higher car prices in the future
D. expectations of lower car prices in the future
Answer: D
You might also like to view...
Which of the following is not a category of consumption spending in the national income accounts?
A) Consumer durables B) Nondurable goods C) Services D) Housing purchases
The constant growth rate rule for money, as initially proposed by Milton Friedman, has been adjusted ________
A) to take the problem of moral hazard in account B) to account for the role played by adaptive expectations in policy formation C) for the difference between real and nominal economic variables D) to allow for possible short-run movements in velocity
Which of the following does NOT affect a worker's marginal productivity?
A) education B) training C) talent D) inheritance of money
The slope of the consumption function shows how: a. consumption changes over time. b. consumption changes as household size changes
c. consumption changes as the price level changes. d. income changes as the level of consumption changes. e. consumption changes as the level of income changes.