Refer to the table below. From 2005 to 2006, what happened to the values of the Japanese yen and the U.S. dollar relative to each other?
The following table shows the foreign currency per U.S. dollar near the end of January of each year listed.
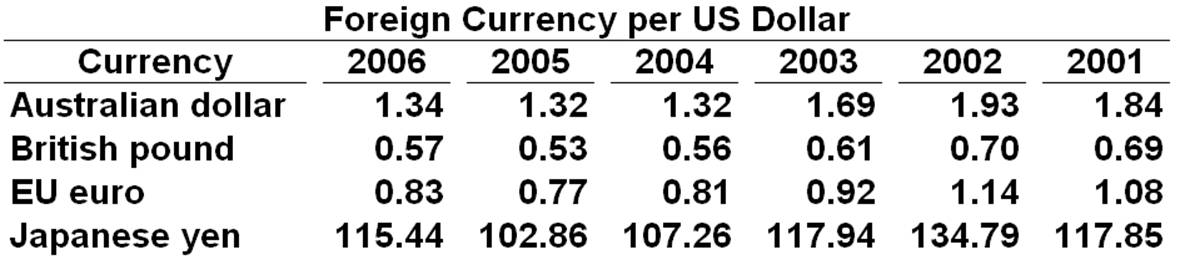
A. The Japanese yen appreciated and the U.S. dollar depreciated
B. The Japanese yen depreciated and the U.S. dollar depreciated
C. The Japanese yen depreciated and the U.S. dollar appreciated
D. The Japanese yen appreciated and the U.S. dollar appreciated
C. The Japanese yen depreciated and the U.S. dollar appreciated
You might also like to view...
The various models of oligopoly explain observed behavior in different industries, but none is satisfactory as a general theory of oligopoly
a. True b. False
Say the required reserve ratio is 20 percent. If you pay back a loan of $10,000 a bank had previously made to you, the act of paying back the loan: a. adds $2,000 in bank reserves
b. adds $10,000 in bank reserves. c. eliminates $2,000 in bank reserves. d. eliminates $10,000 in bank reserves.
Under both the gold standard and the gold exchange standard countries bought and sold U.S. dollars to maintain a fixed exchange rate with the dollar
a. True b. False Indicate whether the statement is true or false
(Consider This) Subsidies for mohair production illustrate:
A. why special-interest effects are often characterized by concentrated benefits and diffuse costs. B. why special-interest effects are often characterized by concentrated costs and diffuse benefits. C. that larger groups carry greater political weight than smaller groups. D. the moral hazard problem.