Refer to the figure below.________ inflation will eventually move the economy pictured in the diagram from short-run equilibrium at point ________ to long-run equilibrium at point ________, 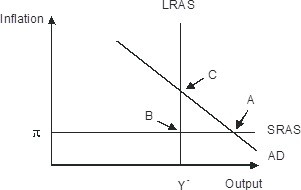
A. Rising; B; C
B. Falling; A; C
C. Falling; A; B
D. Rising; A; C
Answer: D
You might also like to view...
In the above figure, once on PPF2, a country would grow slowest by producing at point
A) A. B) B. C) C. D) D.
An example of the new goods bias in the CPI is the
A) introduction of higher quality brakes as standard equipment on new cars. B) introduction of hybrid automobiles, vehicles that were not made until recently. C) decreasing popularity of SUVs as the price of gasoline has risen. D) switch from traditional car dealerships to low-cost Internet car buying services.
Refer to Table 19-6. Consider the table of production and price statistics for a small economy in 2013. If the economy only produces the four goods listed below, what is GDP for 2013?
A) $428,000 B) $267,000 C) $24,000 D) $1,424
Both ______ and _______ targeted the huge American consumer market as a way to build up their own manufacturing base.
Fill in the blank(s) with the appropriate word(s).