The table shows, for some particular year, a listing of several income levels and, for each level, the proportion of the population in the level and the probability that a person in that level bought a new car during the year. Given that one of the people who bought a new car during that year is randomly selected, find the probability that that person was in the indicated income category. Round your answer to the nearest hundredth. 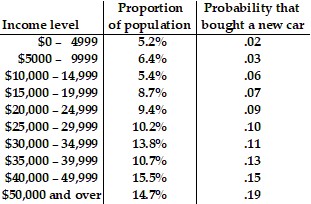 $5000 - $9999
A. .05
B. .01
C. .03
D. .02
Answer: D
Mathematics
You might also like to view...
Find the zeros of the polynomial function.p(x) = x2 - 12x + 36
A. {-6} B. {-6, 6} C. {0, 6} D. {6}
Mathematics
Find the indicated cardinal number.Find n(A × B) given that n(A) = 40 and n(B) = 7.
A. 47 B. 33 C. 54 D. 280
Mathematics
The following question refers to a school district with three high schools. The total number of students in the district is 3000. The teachers within the district are apportioned to the high schools based on the schools' respective enrollments. The standard quota for each school is given in the following table.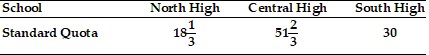 Find the standard divisor for this apportionment problem.
A. 30 B. 10 C. 300 D. 100 E. none of these
Mathematics
Divide. Write a mixed numeral for the answer.
A. 403
B. 402
C. 402
D. 402
Mathematics