Use the given table or graph to write the inequality described.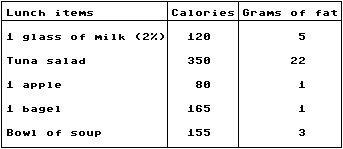 Use an inequality to compare the number of grams of fat in tuna salad and a bowl of soup.
A. 155 < 350
B. 350 > 155
C. 3 > 22
D. 22 > 3
Answer: D
You might also like to view...
Solve the problem.In one U.S. city, the quadratic function 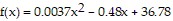 models the median, or average, age, y, at which men were first married x years after 1900. In which year was this average age at a minimum? (Round to the nearest year.) What was the average age at first marriage for that year? (Round to the nearest tenth.)
A. 1936, 52.3 years old B. 1965, 21.2 years old C. 1954, 36 years old D. 1965, 52.3 years old
Determine whether the sequence is geometric.1,  , 7, 7
 , . . .
A. Geometric B. Not geometric
Graph.36x2 - 36y2 + 144x - 216y - 1476 = 0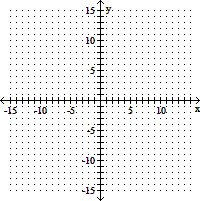
A. 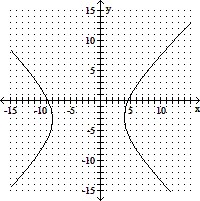
B. 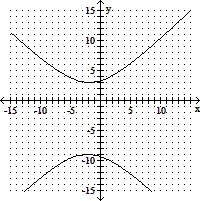
C. 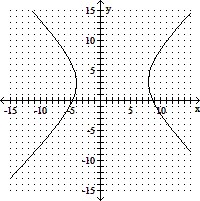
D. 
Solve the formula for the indicated variable with the given information.d = rt for d, with r = 60 miles per hour and t = 4 hours
A. d = 15 miles B. d = 64 miles C. d = 0.7 miles D. d = 240 miles