Solve the problem.The function f models the population of Country X from 1991 to 1998. The graphs of f and the horizontal line y = 805 are shown in the figure. Use the graphs to determine the x-values that satisfy (i) the inequality  and (ii)
  Express your answers symbolically.
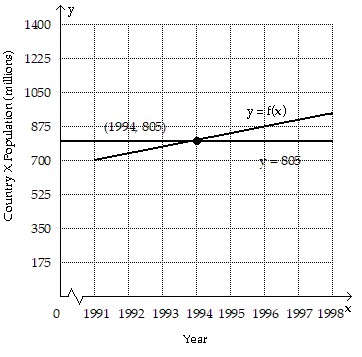
A. {x|x = 1994}; {x|x ? 1994}
B. {x|x = 1994}; {x|x > 1994}
C. {x|x ? 1994}; {x|x > 1994}
D. {x|x > 1994}; {x|x ? 1994}
Answer: D
You might also like to view...
Determine the ratio and write it in lowest terms.5 hours to 40 minutes
A. 
B. 
C. 
D. 
Begin by drawing a rough sketch to determine the number of real solutions for the equation y1 = y2. Then use an analytic method to confirm your answer. Give the solution set and any extraneous values that may occur.y1 =  y2 = 2x
A. 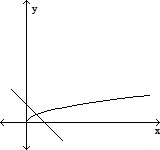
One real solution;  ;
;  is extraneous.
B. 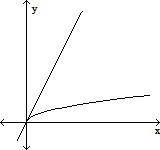
Two real solutions;  ; no extraneous values
C. 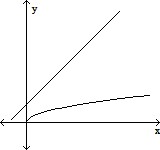
No real solutions; ?; no extraneous values
D. 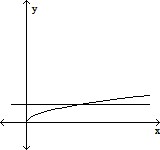
One real solution; {9}; no extraneous values
Find the dot product, u ? v, for the given vectors.u =  , v =
, v = 
A. 126 B. 138 C. 147 D. -78
Solve the system by the substitution method or the addition method.
A. (-3, 2) B. infinite number of solutions C. (10, -1.15) D. (0.06, -0.01)