The following data give the dates of successive turning points in U.S. economic activity and the corresponding levels of real GDP at the time.Turning PointDateReal GDP (1996 $ billions)(A)July 19531992.2(B)May 19541941.0(C)Apr. 19572182.7(D)Apr. 19582117.4(E)Apr. 19602391.0 Which of the turning points are peaks?
A. (A), (B), and (C)
B. (A), (C), and (E)
C. (B) and (D)
D. (C), (D), and (E)
Answer: B
You might also like to view...
The economy could produce at 8 units of outboard motors and 18 units of robots
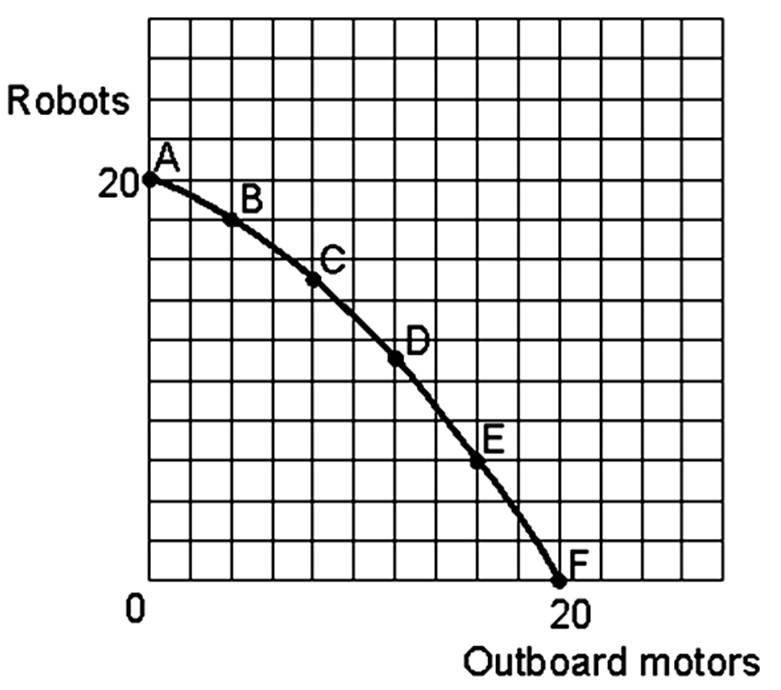
A. immediately only under unusual circumstances such as war.
B. if there is economic growth over a period of years.
C. under no circumstances.
D. immediately only under unusual circumstances such as war AND if there is economic growth over a period of years.
Which of the following is NOT true of an oligopoly?
A) They advertise their product. B) The firms recognize their interdependence. C) A few firm account for a large portion of the total output. D) Firms are price takers.
Opportunity cost:
a. applies only to consumption decisions. b. applies only to production decisions. c. is the same as monetary costs. d. exists because of scarcity. e. is irrelevant for wealthy economies.
The Board of Governors is made up of experts in:
A. finance and banking. B. public policy C. fiscal policy. D. accounting standards.