The following graph shows the populations of the metropolitan areas of City X and City Y over six years. 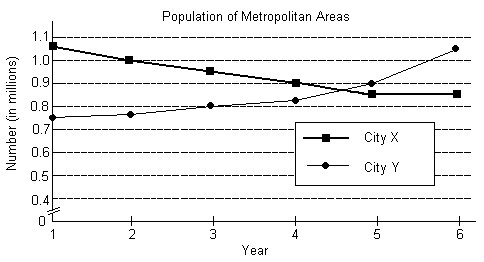 In what years was the population of the City X metropolitan area less than that of the City Y metropolitan area?
A. Years 1-5
B. Years 3-5
C. Years 5-6
D. Years 1-3
Answer: C
Mathematics
You might also like to view...
Perform the indicated operations.-7(-2 + 6 + 1)
A. 63 B. -63 C. -35 D. 35
Mathematics
Solve the equation for solutions in the interval [0°, 360°).sin 2? = cos ?
A. ? = 0°, 120°, 180°, 240° B. ? = 105°, 165°, 285°, 345° C. ? = 15°, 165°, 195°, 345° D. ? = 30°, 90°, 150°, 270°
Mathematics
Perform the division. Write the answer with positive exponents.
A. 6x11 + 4x2 + 7 +  +
+ 
B. 3x3 + 8x10 + 14x8 + 6x6 + 5x5
C. 3x3 + 4x2 + 7
D. 3x3 + 4x2 + 7 +  +
+ 
Mathematics
Establish the identity.tan(? - ?) = tan ?
What will be an ideal response?
Mathematics