Construct a bar graph to represent the given data.The following table shows the average amount spent per week on groceries by four different families with three members.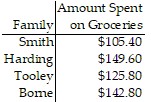
What will be an ideal response?
Answers may vary. The following is a possible answer.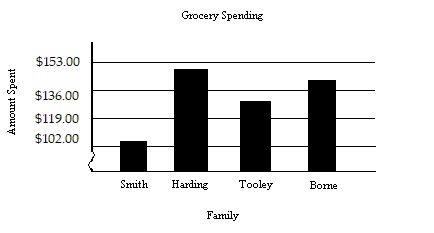
Mathematics
You might also like to view...
Solve the formula for the indicated letter.

Mathematics
Answer the question or solve the problem.In solving the inequality 3x ? -9, would you have to reverse the inequality symbol? Explain why.
What will be an ideal response?
Mathematics
Solve the equation on the interval [0, 2?).sin 2x + sin x = 0
A. 0,  , ?,
, ?, 
B.  ,
,  ,
,  ,
, 
C.  ,
, 
D. no solution
Mathematics
Solve the problem.A coffee can comes packed with enough ground coffee to make 63 cups of coffee. After 42 cups have been made, how many cups of coffee can be made with the remaining ground coffee?
A. 95 cups B. 11 cups C. 105 cups D. 21 cups
Mathematics