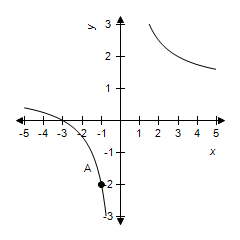
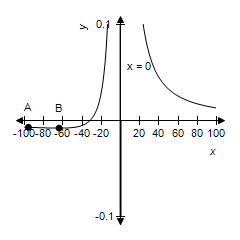
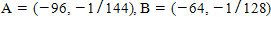
?Sketch the graph of the function given below. Choose a scale that allows all relative extrema and points of inflection to be identified on the graph.

?
A. ?
?
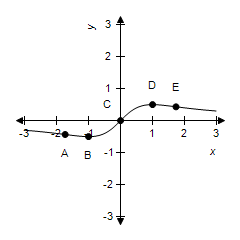
B. ?

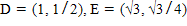
C. ?

D. ?
E. ?

Answer: B
You might also like to view...
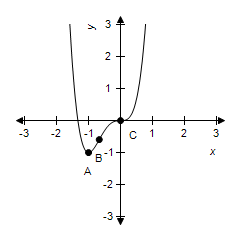
Provide an appropriate response.The given table represents a function. Make a clear graph of the function. 

A. 
B. 
C. 
D. 
You are given the population and the growth rate as of 2000 for a hypothetical country. Assume that the growth rate remains the same from year to year. Using an exponential function to model population growth, determine the size of the population in the specified year.Population = 28 million, growth rate = 1.7 percent, year: 2018
A. 37.9 million B. 28.0 million C. 38.6 million D. 37.3 million
Simplify the complex rational expression.
A. 
B. 
C. 72x
D. 
Use the statistical display to answer the question.Marriage Licenses Issued (Each ? represents 20,000 licenses)How many licenses are issued in July?
A. 70,000 B. 7,000 C. 75,000 D. 80,000