Suppose that the average adult in the United States will work x number of days (rounded to the nearest day) to earn enough to pay for all of the household's leisure activities in that year. This number can be calculated by multiplying the average percent of household income spent on leisure activities by 365 (the number of days in a year). The bar graph shows the percent of income spent in various countries of the world. Use the graph to answer the question.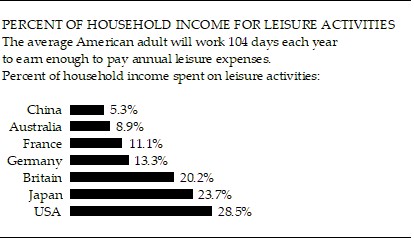 In which country is the lowest percent of income spent on leisure activities? What percent is this?
A. China; 5.3%
B. USA; 71.5%
C. China; 94.7%
D. Australia; 8.9%
Answer: A
You might also like to view...
Write the indicated statement. Use De Morgan's Laws if necessary.If I pass, I'll party.Contrapositive
A. I'll party if I pass. B. If I don't pass, I won't party. C. If I party, then I passed. D. If I don't party, I didn't pass.
Determine whether the statement is true or false. If it is true, explain why it is true. If it is false, give an example to show why it is false.
?
The function  is a solution of the differential equation
  .
.
What will be an ideal response?
Graph the function by starting with the graph of the basic function and then using the techniques of shifting, compressing, stretching, and/or reflecting.f(x) = (x - 4)3 - 3
A. 
B. 
C. 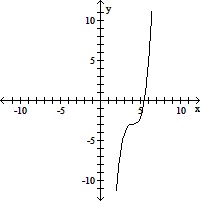
D. 
Use the fact that the trigonometric functions are periodic to find the exact value of the expression. Do not use a calculator.csc 960°
A. -
B. -
C. - 
D. - 