Explain the various components of a market demand curve that would show the influence of the price of cinnamon in the United States.
What will be an ideal response?
To show the influence of the price of cinnamon in the United States, the market demand curve would have to track the quantity of cinnamon that consumers across the United States would be able and willing to buy at various prices. To focus on price, all other variables, such as taste, quality, or origin of cinnamon, would be constant. The information would be shown on a graph showing the quantity of cinnamon demanded at certain prices. A line or curve would trace the points where price and demand intersect.
You might also like to view...
When it comes to pollution problems, the polluter and the victim can bargain to arrive at the outcome desired by the benevolent social planner
Indicate whether the statement is true or false
Which of the following is not a major trading partner of the U.S.?
a. Canada b. Mexico c. Russia d. China
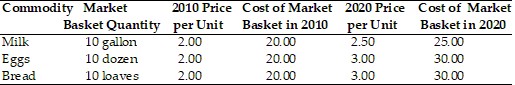 In the table shown above, the total cost of the market basket in 2010 was
A. $6.00. B. $85.00. C. $60.00. D. $8.50.
Without a copyright, the high fixed costs of textbook creation
A. would be lower. B. would be more easily recoverable. C. would be higher. D. would be nearly impossible to recover.