Graph the compound inequality.x > y + 1 or y > -1
A. 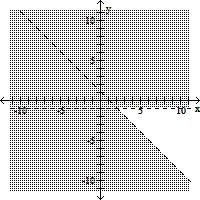
B. 
C. 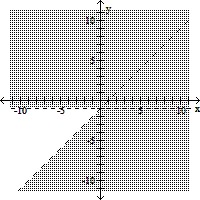
D. 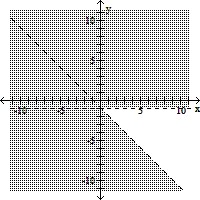
Answer: C
You might also like to view...
The following table shows the gross national product G, in trillions of dollars, t years after 2005. Use the regression line for the data to estimate the gross national product in 2013. t 0 1 3 5 G 12.76 13.54 14.29 14.66? ?
A. 15.95 trillion dollars B. 16.55 trillion dollars C. 17.80 trillion dollars D. 18.35 trillion dollars
Solve the problem.A manufacturer uses raw materials to produce p products each day. Suppose that each delivery of a particular material is $d, whereas the storage of that material is x dollars per unit stored per day. (One unit is the amount required to produce one product). How much should be delivered every x days to minimize the average daily cost in the production cycle between deliveries?
What will be an ideal response?
Find the LCM of the list of numbers.6, 12
A. 432 B. 72 C. 6 D. 12
Verify the identity. =
= 
What will be an ideal response?