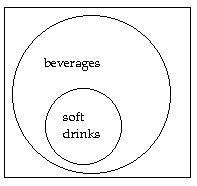
Solve the problem.Draw a Venn diagram showing the relationship between beverages and soft drinks.
What will be an ideal response?
You might also like to view...
Provide an appropriate response.True or false? This pair of equations is equivalent.  and
and 
What will be an ideal response?
Write a description of the shaded region using the symbols A, B, C, ?, ?, -, and ' as needed.
A. A ? B B. A' ? B' C. A - B D. (A ? B)'
Graph the linear inequality.-5y > 2x + 10
A. 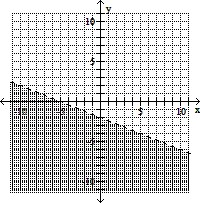
B. 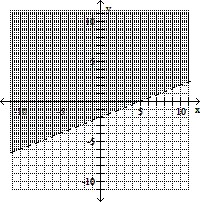
C. 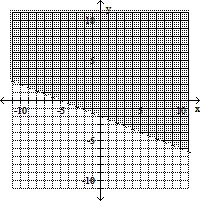
D. 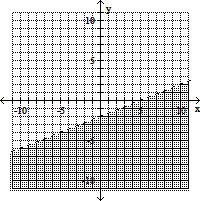
A wildlife biologist has spent the past 5 years studying the relationship between the length (inches) and the average weight (lb) of the striped bass. His results are summarized in the table below. Length(inches) Weight(lb) 14 3 18 6 22 11 26 14 Find the least squares regression line y = ax + b for the data in the table, where x represents the length of the fish in inches and y represents the weight in pounds. Use this regression line to estimate the average weight of a striped bass that is 21 inches in length.
A. y = 0.85(21) - 12.5 = 5.35 lb B. y = 0.95(21) - 10.5 = 9.45 lb C. y = 0.95(21) - 8.5 = 11.45 lb D. y = 0.75(21) - 9.5 = 6.25 lb E. y = 0.65(21) - 10.5 = 3.15 lb