Use the REGRESSION feature on a graphing calculator.A study was conducted to compare the average time spent in the lab each week versus course grade for computer students. The results are recorded in the table below. 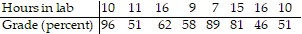 Use linear regression to find a linear function that predicts a student's course grade as a function of the number of hours spent in lab.
A. y = 88.6 - 1.86x
B. y = 1.86 + 88.6x
C. y = 0.930 + 44.3x
D. y = 44.3 + 0.930x
Answer: A
Mathematics
You might also like to view...
Solve the problem.How many liters of a 20% alcohol solution must be mixed with 50 liters of a 40% solution to get a 30% solution?
A. 100 L B. 10 L C. 50 L D. 5 L
Mathematics
Perform the indicated operations. Write the result using only positive exponents. Assume all variables represent nonzero real numbers.
A. 
B. x12
C. 
D. -x16
Mathematics
Solve.In a lab experiment, 600 ml of salt water was added to 1.82 L of water. Later 230 ml of the solution was drained off. How many ml of the solution still remain?
A. 436.2 ml B. 552 ml C. 2190 ml D. 2438.2 ml
Mathematics
Perform the indicated operations and simplify the result. Leave the answer in factored form.
A. 18 B. x2 C. 2x D. -18
Mathematics