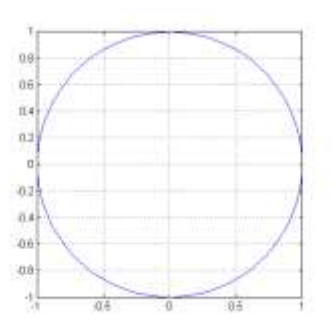
Plotting a circle. The following script plot a circle using 101 points that appears as a circle (not an ellipse) on the plot Find the error in the script.
i = 0:100; % define index array
x = cos(2*pi*i/100); % element-by-element multiplication
y = sin(2*pi*.i/100);
plot(x,y)
axis([-1 1 -1 1]) % axis limits [xmin xmax ymin ymax]
axis square % square axis
grid on % display grid
Solution
i = 0:100; % define index array
x = cos(2*pi*i/100); % element-by-element multiplication
y = sin(2*pi*i/100); % <-
plot(x,y)
axis([-1 1 -1 1]) % axis limits [xmin xmax ymin ymax]
axis square % square axis
grid on % display grid
You might also like to view...
What type of oil is specified for R-1234yf systems?
A) PAG with an added sealer fluid B) The same oil that R-134a uses C) A special mineral oil D) PAG with a special additive package
What is a datum?
What will be an ideal response?
Renovation of a lawn is done best _____
A) in the fall B) in the winter C) after the active growing season D) before the active growing season
?Acetylene is unstable at temperatures above ____ Fahrenheit.
A. ?1435° B. ?1535° C. ?1635° D. ?1735°