Refer to the following figure. Which of the following expresses economic growth?
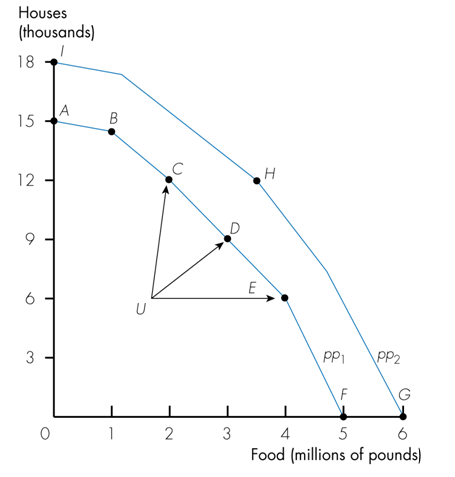
a. Movement from Point U to Point C
b. Movement from Point U to Point D
c. Movement from Point U to Point E
d. A shift of the Production Possibilities Curve from PP1 to PP2
d. A shift of the Production Possibilities Curve from PP1 to PP2
You might also like to view...
The marginal expenditure curve for labor is based on the assumption that
A) the most productive workers are hired first. B) the wage rate is independent of the quantity of labor employed. C) the market supply curve for labor is infinitely elastic. D) all workers are paid the same wage rate. E) none of the above
A subsidy to wheat farmers will
A. decrease the quantity of wheat supplied. B. leave both the supply and demand of wheat unchanged. C. increase the supply of wheat. D. increase the quantity of wheat demanded.
In a monopoly market structure, the firm (the monopolist) always
A) is the whole industry. B) produces too much. C) sells faulty products. D) earns economic profit.
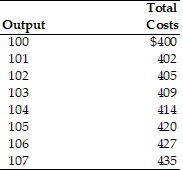 Refer to the above table. If the price is $5, the perfectly competitive firm should produce
A. 105 units. B. 106 units. C. 107 units. D. 104 units.