Solve the problem.The following data represents the normal monthly precipitation for a certain city in California. 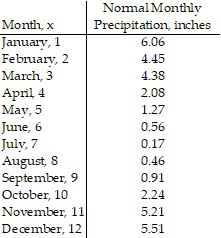 Draw a scatter diagram of the data for one period. Find a sinusoidal function of the form
 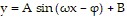 that fits the data. Draw the sinusoidal function on the scatter diagram. Use a graphing utility to find the sinusoidal function of best fit. Draw the sinusoidal function of best fit on the scatter diagram.
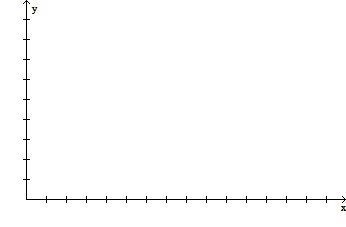
What will be an ideal response?
y = 3.14 sin (0.46x + 1.52) + 3.16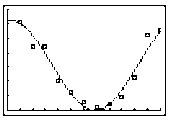
You might also like to view...
Graph the function f(x) over the given interval. Partition the interval into 4 subintervals of equal length. Then add to your sketch the rectangles associated with the Riemann sum  , using the indicated point in the kth subinterval for ck.f(x) = x2 - 3, [0, 8], midpoint
A. 
B. 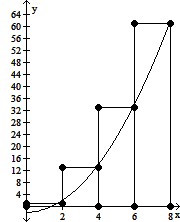
C. 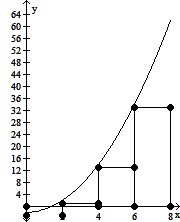
D. 
Use the graph to estimate any solutions to the given equation on the interval  cos2x =


A.  ,
,  ,
,  ,
, 
B.  , ? ,
, ? , 
C.  ,
, 
D. 0, ?
Solve the problem.Suppose that f(x) = -x - 6 and g(x) = x - 14.(a) Solve f(x) = 0.(b) Solve g(x) = 0.(c) Solve f(x) = g(x).
A. (a) x = 6; (b) x = 14; (c) x = 4 B. (a) x = -6; (b) x = -14; (c) x = 4 C. (a) x = -6; (b) x = 14; (c) x = -10 D. (a) x = -6; (b) x = 14; (c) x = 4
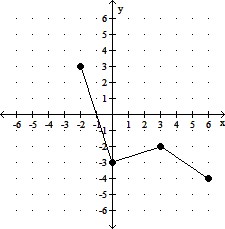
Perform the specified translation.The graph on the left is the graph of the function defined by y = f(x). 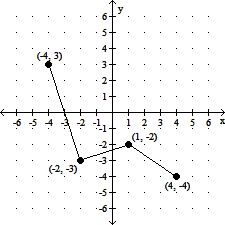
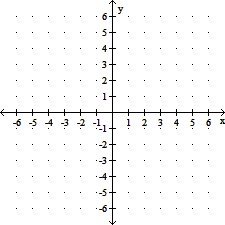 Sketch a graph of the function defined by the equation y = f(x) + 2. Describe the type of shift that was performed on the original graph.
A. A horizontal shift of the graph of y = f(x),
2 units to the left.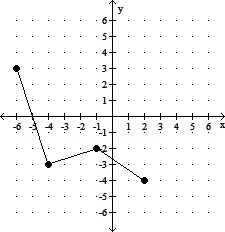
B. A vertical shift of the graph of y = f(x),
2 units upward.
C. A vertical shift of the graph of y = f(x),
2 units downward.
D. A horizontal shift of the graph of y = f(x),
2 units to the right.