Use the following table to answer the next question. The following national income data for an economy is in billions of dollars.Consumption$5,100Investment1,100Transfer payments1,050Government purchases1,400Exports850Imports950Net foreign factor income20What are the net exports for this economy?
A. ?$100 billion
B. $950 billion
C. $850 billion
D. $100 billion
Answer: A
You might also like to view...
Which of the following is not assumed constant along the U.S. demand curve for foreign exchange?
a. the exchange rate b. U.S. interest rates c. expected U.S. inflation d. expected foreign inflation e. increase in U.S. income
The production possibilities frontier illustrates
a. the trade-off between efficiency and equality. b. the combination of output that an economy should produce. c. the combination of output that each member of society should consume. d. None of the above is correct.
Exhibit 4-6 Demand and supply curves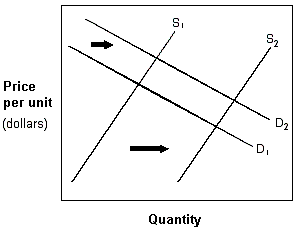 If the market demand and supply curves shift as given in Exhibit 4-6, the resulting new equilibrium will show a(n):
A. increase in market price and a decrease in the quantity exchanged. B. decrease in market price and a decrease in the quantity exchanged. C. increase in market price and an increase in the quantity exchanged. D. decrease in market price and an increase in the quantity exchanged.
Because the demand for the matinee showing is ________________ elastic than the demand for the evening showing, the demand curve for matinees is _______________ than the demand for evening movie showings.
a. less, steeper b. less, flatter c. more, flatter d. more, steeper