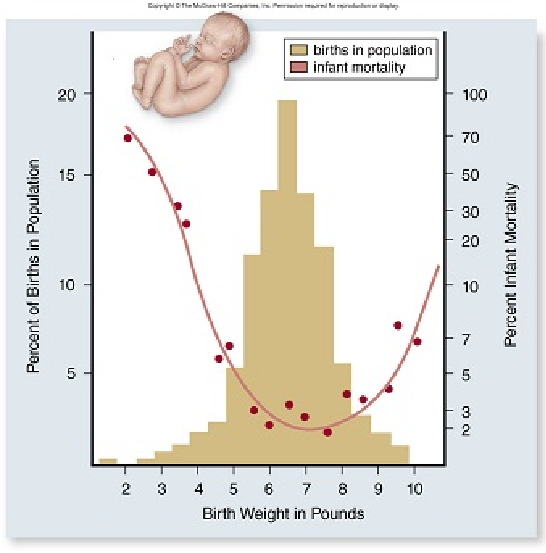
In the graph below, how can the change in infant mortality be explained as birth weight increases from 2 to 7 pounds?
A. A larger baby will have more developed organs and thus have greater fitness.
B. A baby closer to 7 pounds will have more developed organs and thus have lower mortality.
C. A baby closer to 2 pounds will not be able to be delivered safely and thus have lower mortality.
D. A baby closer to 7 pounds will have more developed organs and thus have higher motality.
E. A baby closer to 7 pounds will not be able to be delivered safely and thus have higher mortality.
Clarify Question
· What is the key concept addressed by the question?
· What type of thinking is required?
· What key words does the question contain and what do they mean?
Gather Content
· What do you already know about fitness? How does it relate to the question?
Consider Possibilities
· What other information is related to the question? Which information is most useful?
Choose Answer
· Given what you now know, what information and/or problem solving approach is most likely to produce the correct answer?
Reflect on Process
· Did your problem-solving process lead you to the correct answer? If not, where did the process break down or lead you astray? How can you revise your approach to produce a more desirable result?
A. A larger baby will have more developed organs and thus have greater fitness.
Clarify Question
· What is the key concept addressed by the question?
o This question is asking you to interpret data from a graph and draw a conclusion about a baby’s chances of survival based upon the birth weight.
· What type of thinking is required?
o This is an analyze question because you have to interpret a graph to figure out how a baby’s weight is related to its mortality.
· What key words does the question contain and what do they mean?
o Mortality, which means being in a state of death.
o Birth weight, which refers to the mass of a newborn.
o Correlation, which refers to a relationship between to two variables.
Gather Content
· What do you already know about fitness? How does it relate to the question?
o Fitness is defined by an organism’s reproductive success relative to other members of its population. Compare how the percent infant mortality is influenced by the birth weight in pounds. How could an infant’s birth weight influence its ability to grow old enough to reproduce?
Consider Possibilities
· What other information is related to the question? Which information is most useful?
o Analysis of the graph will allow you to identify the rate of infant mortality based upon their birth weight. During gestation, the developing fetus grows in size. How are the infant’s organs developing during this time? What happens to infant mortality if the infant grows beyond seven pounds?
Choose Answer
· Given what you now know, what information and/or problem solving approach is most likely to produce the correct answer?
o This question requires you to interpret a graph and analyze the data being presented. In this graph there are two sets of data. One is the percent of infant mortality and the other is percent of births in a population. These two sets of data can have no correlation or they be correlated. If they are correlated, then they can have a positive correlation, where both variables can change in the same direction, or they can have a negative correlation where one variable increases while another variable decreases.
Reflect on Process
· Did your problem-solving process lead you to the correct answer? If not, where did the process break down or lead you astray? How can you revise your approach to produce a more desirable result?
o This question asked you how changes in infant mortality can be explained by changes in birth weight.
o Answering this question correctly depended not only on distinguishing between changes in infant mortality and changes in birth weight, but on your ability to break down, or analyze, a graph related to changes in infant mortality and changes in birth weight.
o If you got the correct answer, excellent! If you got an incorrect answer, where did the process break down? Did you remember how two sets of data are related, or that an infant’s development in the womb can influence its mortality and survivability? Did you have trouble breaking down the graph to determine the correct answer?
You might also like to view...
List the characteristics of the following groups and identify examples for each: Archaea, Bacteria, and
Eukarya. What will be an ideal response?
In the accompanying figure, what process is occurring at point Process B?
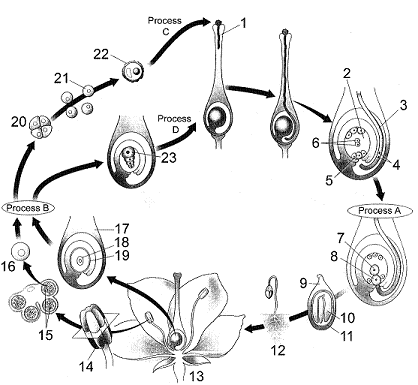
a. mitosis
b. meiosis
c. pollination
d. fertilization
e. development of embryo sac
During secondary succession, ecosystems are able to reestablish themselves after a devastating event. Which of these events most likely will lead to primary succession?
A) forest fire B) volcanic eruption C) earthquake D) flood
The type of change in chromosomal structure in which a chromosome segment is repeated in the same chromosome is called a(n) _______.
a. inversion b. translocation c. deletion d. duplication