Figure 4-20
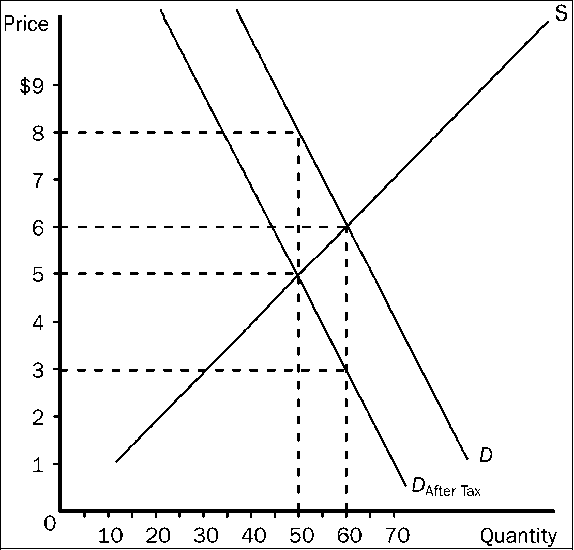
Refer to . Suppose the same S and D curves apply, and a tax of the same amount per unit as shown here is imposed. Now, however, the sellers of the good, rather than the buyers, are required to pay the tax to the government. Now, relative to the case depicted in the figure,
a.
the burden on buyers will be larger and the burden on sellers will be smaller.
b.
the burden on buyers will be smaller and the burden on sellers will be larger.
c.
the burden on buyers will be the same and the burden on sellers will be the same.
d.
The relative burdens in the two cases cannot be determined without further information.
c
You might also like to view...
How has the distribution of income changed in the past few decades?
What will be an ideal response?
The Fed's interest rate response to the rising output ratio experienced from 1997 to 1999 is explained by
A) beneficial supply shocks which pushed down the inflation rate. B) the Fed's efforts to help end the Asian financial crisis C) the Fed's uncertainty about the concepts of the natural level of output and natural rate of unemployment. D) All of the above.
If total consumption is $5 billion, investments $2 billion, government purchases $1 billion, exports $1 billion, and imports $3 billion, the GDP must equal:
A. $6 billion. B. $12 billion. C. $9 billion. D. $3 billion.
Your grandfather tells you that he earned $.50 per hour at his job when he was a boy in 1929
a. Given that the CPI was 17.1 in 1929 and 184.0 in 2003, how much would you have to make in 2003 to have the same real hourly wage? b. You made $5.50 an hour working during 2003 . Were you better off than your grandfather in terms of purchasing power? Explain. c. Your grandfather also tells you that a soda cost $.05 in 1929, and you know a soda cost $.55 in 2003 . You decide to use the price of a soda as the price index. How much would the 2003 "soda equivalent" of $.50 per hour in 1929 be?