Add.23 + 5 + (-24)
A. -6
B. 4
C. 42
D. 52
Answer: B
You might also like to view...
Estimate the indicated probability.The table shows the number of college students who prefer a given pizza topping.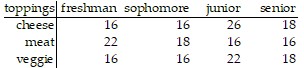 Determine the empirical probability that a freshmen prefers cheese toppings. Round to the nearest thousandth.
A. 0.296 B. 0.211 C. 0.073 D. 0.407
The histogram shows the scores of each participant in a game from a total of 100 participants. 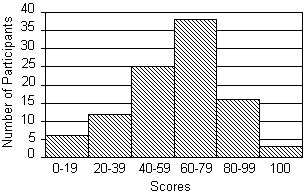 How many participants scored 100?
A. 25 participants B. 12 participants C. 6 participants D. 3 participants
The graph of a function is given. Determine whether the function is increasing, decreasing, or constant on the given interval.(2.2, 5) 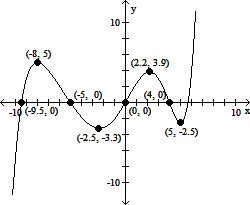
A. decreasing B. constant C. increasing
Find n(A) for the set A.A = {x?x is a month in the year}
A. n(A) = 52 B. n(A) = 1 C. n(A) = 12 D. n(A) = 24