Graph the function.g(x) = 
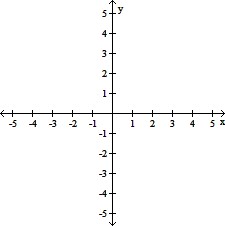
A. 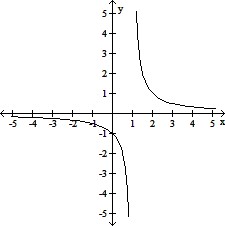
B. 
C. 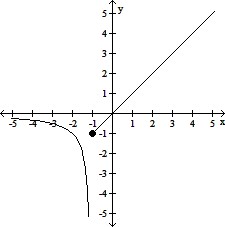
D. 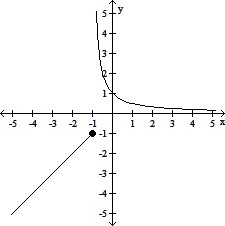
Answer: C
You might also like to view...
Estimate the indicated probability.The table shows the number of college students who prefer a given pizza topping.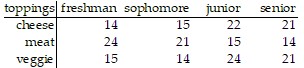 Determine the empirical probability that a student prefers meat toppings. Round to the nearest thousandth.
A. 0.336 B. 0.324 C. 0.109 D. 0.327
Solve the problem.Austin invested $12,000 in an account at 11% compounded quarterly. Find the amount in Austin's account after a period of 5 years.
A. $8645.14 B. $20,220.70 C. $20,645.14 D. $20,092.59
Convert the given measurement to the unit indicated.43.04 dam to m
A. 430.4 m B. 4304 m C. 0.43 m D. 4.304 m
Fill in each blank with the appropriate response.The graph of y = -  (x + 3)2 - 8 can be obtained from the graph of y = x2 by shifting horizontally
  units to the
  , vertically compressing by a factor of
  , reflecting across the
  -axis, and shifting
vertically  units in the
  direction.
A. 3; right;  ; x; 8; upward
B. 3; left; 8; x;  ; downward
C. 3; left;  ; x; 8; downward
D. 3; right;  ; x; 8; downward