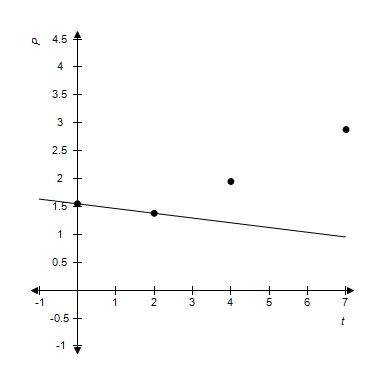
The following table shows the average price P, in dollars, of a gallon of regular gas t years after 2000.
t 0 2 4 7 P 1.55 1.38 1.95 2.88A: Find the equation of the regression line.B: Plot the data along with the regression line.C: Explain in practical terms the meaning of the slope of the regression equation.D: What price does the regression line predict for 2011?
What will be an ideal response?

?
B:
?
?
C: During the period from 2000 to 2004, the price of a gallon of regular gas increased by about 0.21 dollar each year.
?
D: $3.58
You might also like to view...
Find the specified maximum and / or minimum.Find the maximum and minimum of 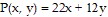 subject to
  ,
,  ,
,  .
.
A. 280, 36 B. 280, 220 C. 60, 36 D. 220, 24
Is the function graphed one-to-one?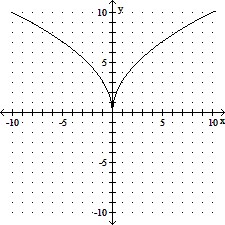
A. Yes B. No
Solve the problem.After introducing an inhibitor into a culture of luminescent bacteria, a scientist monitors the luminosity produced by the culture. Use a graphing utility to fit a logarithmic function to the data. Round values to the nearest hundredth. Then, use the function to predict the luminosity, to the nearest hundredth, after 20 hours. 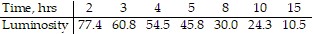
A. y = 100.5 - 32.7 ln x; 2.54 B. y = 98.75 - 32.66 ln x; 0.91 C. y = 107.55 - 41 ln x; -15.27 D. y = 112.97 - 45.97 ln x; -24.74
Solve.By switching service providers, a family's telephone bill decreased from about $50 a month to about $43. What was the percent of decrease?
A. 16.3%
B. 14%
C.
| 7% |
D. 15%