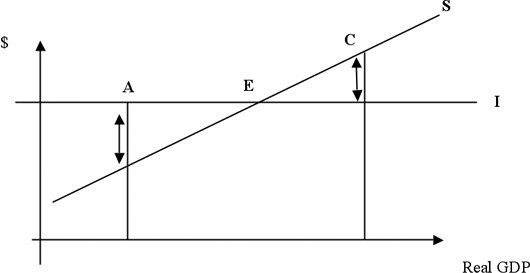
 In the above figure, point E represents the level of real GDP at which planned saving equals planned investment. At point A
A. unplanned inventories decrease.
B. changes in inventories cannot be determined.
C. unused industrial capacity exists in the economy.
D. unplanned inventories increase.
Answer: A
You might also like to view...
Which of the following are considered sources of bias in the CPI?
a. Prices changing too rapidly; substitution, new technologies; and quality changes. b. Prices changing too rapidly; substitution; quality changes; and growth in discounting. c. Quality changes; new technologies; prices changing too rapidly; and growth in discounting. d. Substitution; new technologies; prices changing too rapidly; and growth in discounting. e. Quality changes; new technologies; substitution; and growth in discounting.
Use the following table to answer the question. Dave's Production Possibilities ScheduleSimon's Production Possibilities SchedulePounds of Green BeansPounds of CornPounds of Green BeansPounds of Corn0160080201204060408080406040120208001600Assume Dave consumes 40 pounds of green beans and 80 pounds of corn without trade. Also, assume that Simon consumes 80 pounds of green beans and 40 pounds of corn without trade. Suppose Simon and Dave specialize and that the terms of trade are 1 pound of green beans for 1 pound of corn. If Simon sells Dave 80 pounds of green beans, then the gains from trade for Dave are ________ pounds of green beans and ________ pounds of corn with trade and specialization.
A. 20, 20 B. 0, 40 C. 40, 0 D. 40, 40
According to the law of demand there is negative relationship between ________ and ________.
A. price; demand B. price; quantity demanded C. quantity; income D. price; income
To derive the labor market demand curve, the labor demand curves for each firm in the output market of interest are summed
Indicate whether the statement is true or false