Solve the problem.Find the point on the parabola  that is closest to the line
  Use the fact that the line connecting the closest points on each curve is normal to both curves.
A. 
B. 
C. 
D. 
Answer: A
You might also like to view...
For a certain population the growth rate G, measured in thousands per year, depends on the population n, measured in thousands. The relationship is
 .
.
?
A: Make a graph of G versus t. Include populations of up to 120,000 (corresponding to  ).B: Explain what is happening to the population at
  thousand and at
  thousand.C: Over what population ranges is G negative?D: Explain in practical terms what is happening to the population over the population ranges you found in part C.
What will be an ideal response?
Solve the problem.The bar graph shows the percentage of students at State University that owned portable MP3 players from 2006 through 2012.  The function f(x) = -0.9x2 + 16x + 10 models the percentage of students that owned portable MP3 players at State University , f(x), x years after 2006.a. Use the function to find the percentage of of students that owned portable MP3 players at State University in 2011. Does this overestimate or underestimate the percentage in the graph? By how much?b. Use the function to determine the first year in which 80% of students owned portable MP3 players at State University.
A. a. 67.5%; underestimates by 1.5% b. 2015 B. a. 67.5%; overestimates by 1.5% b. 2014 C. a. 67.5%; overestimates by 1.5% b. 2015 D. a. 67.5%; underestimates by 1.5% b. 2014
Solve the problem.The following table shows the number of dog collars, in thousands, produced by Allied Pet Products in the 3 years considered. 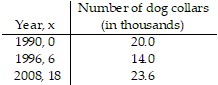 Fit a quadratic function f(x) = ax2 + bx + c to the data. Using this function, what would you predict the dog collar production of Allied Pet Products to be in 2022?
A. 86,200 collars B. 31,200 collars C. 71,200 collars D. 91,200 collars
What is 30% of 140?
A) 0.42 B) 420 C) 42 D) 4200 E) 4.2