Which is the best summary of this graph?
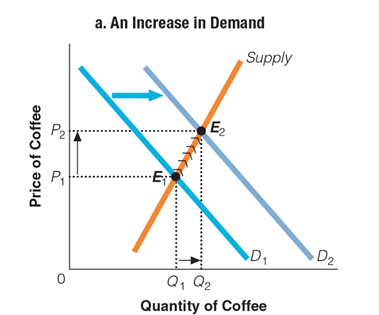
a. An increase in demand eventually leads to higher equilibrium price and quantity.
b. An increase in demand leads to a shift in the supply curve.
c. A higher equilibrium price and quantity leads to an increase in the quantity supplied.
d. An increase in demand eventually leads to lower equilibrium price and quantity.
a. An increase in demand eventually leads to higher equilibrium price and quantity.
You might also like to view...
Joe likes to sleep late in the mornings and play tennis in the afternoons. The opportunity cost of Joe attending his morning class for one hour is
A) an hour of tennis given u
In order for a taxicab to be operated in New York City, it must have a medallion on its hood. Medallions are expensive, but can be resold, and are therefore an example of
A) a fixed cost. B) a variable cost. C) an implicit cost. D) an opportunity cost. E) a sunk cost.
You lose your job and, as a result, you buy fewer iTunes music downloads. This shows that you consider iTunes music downloads to be a(n) a. luxury good
b. inferior good. c. normal good. d. complementary good.
How does imperfect information affect market decisions?
a. It doesn't, because information is generally excellent. b. It leads to inefficient outcomes in which expected benefits and actual benefits diverge. c. It leads to wasteful attempts to improve information. d. It leads to exploitation of sellers by buyers.