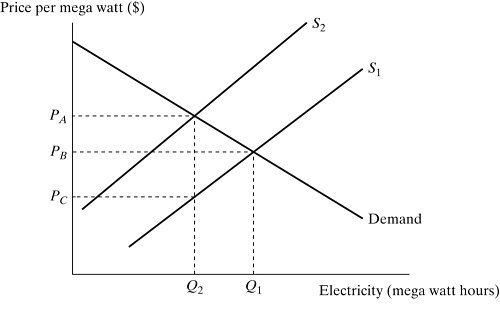
 Figure 16.3Figure 16.3 depicts a market for electricity. S1 is the supply curve without the external costs. S2 is the supply curve with the $T tax. Assume electricity production incurs external costs. If the government imposes a pollution tax in the amount illustrated, the amount of the pollution tax borne by the electricity producers is:
A. PA - PB.
B. PA - PC.
C. PB - PC.
D. (1/2)?(PA - PB).
Answer: C
You might also like to view...
The type of monetary policy regime that the Federal Reserve has followed From the 1980s up until the time Ben Bernanke became chair of the Federal Reserve in 2006 can best be described as
A) monetary targeting. B) inflation targeting. C) policy with an implicit nominal anchor. D) exchange-rate targeting.
Actions that ignore the possible long-run benefits of cooperation and focus solely on short-run gains are
A) a zero-sum game. B) a negative-sum game. C) tit-for-tat strategic behavior. D) opportunistic behavior.
Suppose a society begins by producing 3 units of X and 4 units of Y and then alters production to 4 units of X and 4 units of Y. If the quantity and quality of resources and the technology being used remain unchanged, then:
a. 3 units of X and 4 units of Y are a combination best represented by a point inside the production possibilities curve [PPC]. b. we can conclude that the society has moved along the PPC. c. we can conclude that resources were being fully utilized at 3 units of X and 4 units of Y. d. we can conclude that resources were being efficiently utilized at 3 units of X and 4 units of Y. e. 3 units of X and 4 units of Y are a combination best represented by a point outside the PPC.
The time it takes for a policy to actually work is known as:
A. fiscal policy. B. crowding out. C. inside lags. D. outside lags.