Refer to Figure 3-7. Assume that the graphs in this figure represent the demand and supply curves for potatoes and that steak and potatoes are complements. What panel describes what happens in this market when the price of steak rises?
A) Panel (a) B) Panel (b) C) Panel (c) D) Panel (d)
D
You might also like to view...
Use the following diagram in which S is the market supply curve and S1 is a supply curve comprising all costs of production, including external costs, to answer the question below.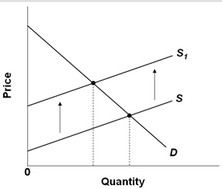 Assume that the number of people affected by these external costs is large. If the government wishes to establish an optimal allocation of resources in this market, it should
A. tax producers so that the market supply curve shifts leftward (upward). B. subsidize consumers so that the market demand curve shifts leftward. C. not intervene because the market outcome is optimal. D. subsidize producers so that the market supply curve shifts leftward (upward).
Fluctuations in total output are the reverse image of fluctuations in
A) the inflation rate. B) the unemployment rate. C) gross domestic product. D) the GDP deflator.
As the number of substitutes for a good increases, its own-price elasticity becomes more
a. Unitary b. Relatively elastic c. relatively inelastic. d. perfectly inelastic.
Assume the money market is initially in equilibrium. If the price level decreases, then according to liquidity preference theory there is an excess
a. supply of money until the interest rate increases. b. supply of money until the interest rate decreases. c. demand for money until the interest rate increases. d. demand for money until the interest rate decreases.