The above figure shows four different markets with changes in either the supply curve or the demand curve. Which graph best illustrates the market for computer manuals after technological advances in making computers occur?
A) Graph A
B) Graph B
C) Graph C
D) Graph D
A
You might also like to view...
A tax in an efficient market:
A. increases efficiency. B. decreases total surplus. C. maximizes total surplus. D. often fails to generate revenue.
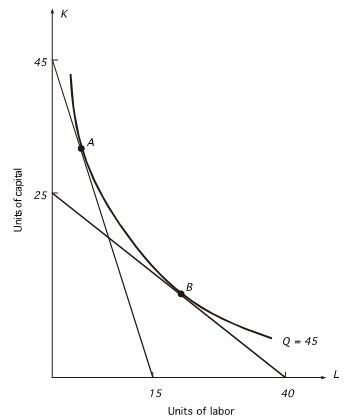 Given the above graph, as you move from point A to point B,
A. output is unchanged. B. cost is unchanged. C. the rate at which the firm can substitute labor for capital while holding output constant decreases. D. both a and b E. both a and c
Suppose a firm can produce 70 units of a product, Zenia, by combining labor, land, capital, and entrepreneurial ability, as in the four alternative techniques shown in the table below. Assume further that the firm can hire labor at $3 per unit, land at $3 per unit, capital at $6 per unit, and entrepreneurship at $9 per unit. Techniques ABCDLabor41065Land5333Capital5244Entrepreneurship1111 Refer to the provided table, and suppose that the firm uses production technique D. If each of the 70 units of Zenia that are produced sells for $1 apiece, then how much will be the total profits of the firm from 70 units of Zenia?
What will be an ideal response?
When plasma television sets were first introduced prices were high and few firms were in the market. Later, economic profits attracted new firms and the price of plasma televisions fell. This example illustrates
A) a decreasing-cost industry. B) that consumers receive this new technology "free of charge" in the sense that they only have to pay a price for plasma televisions equal to the lowest production cost. C) an industry with a low minimum efficient scale. D) how fickle consumer demands are.