Which of the following statements with respect to the figure below is INCORRECT?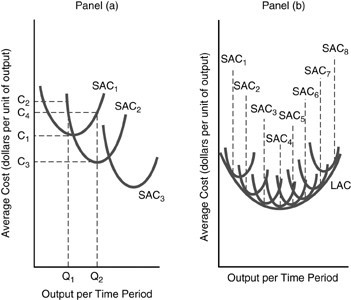
A. All the possible short-run average cost curves that correspond to the different plant sizes are shown as SAC1 - SAC8.
B. If the permanent rate of output increases to Q2 in panel (a), it will be more profitable to have a plant size corresponding to SAC3.
C. The long-run average cost curve LAC in panel (b) is sometimes called the planning curve representing the locus (path) of points.
D. If the anticipated permanent rate of output per unit time period is Q1 in panel (a), the optimal plant would correspond to SAC1.
Answer: B
You might also like to view...
Under ________ there are many firms selling identical products
A) perfect competition B) monopolistic competition C) oligopoly D) monopoly
If real GDP per capita measured in 2009 dollars was $6,000 in 1950 and $48,000 in 2016, we would say that in the year 2016, the average American could buy ________ times as many goods and services as the average American in 1950
A) 1/8 B) 4 C) 8 D) 12
Under Special 301, what is the U.S. government required to do?
What will be an ideal response?
In Coase's confectioner and doctor example, what was the externality?
a. The doctor building his office so close to the confectioner. b. The vibrations generated by the confectioner's production process. c. The large number of people entering the confectioner's factory thinking it was the doctor's office. d. The screams of the doctor's patients disrupted factory workers from performing their duties.