Refer to Figure 13-4. In the figure above, AD1, LRAS1 and SRAS1 denote AD, LRAS and SRAS in year 1, while AD2, LRAS2 and SRAS2 denote AD, LRAS and SRAS in year 2
Given the economy is at point A in year 1, what is the actual growth rate in GDP in year 2?
A) 2.5% B) 7.3% C) 8.0% D) 10.0%
B
You might also like to view...
Using the data in the table above, if the price of a stapler is $5, then there is ________ of staplers, and the quantity of staplers demanded ________ the quantity of staplers supplied
A) a shortage; is greater than B) a surplus; is less than C) a shortage; is less than D) a surplus; is greater than E) neither a surplus nor a shortage; equals
An increase in the price of raw materials will shift both the MC and the ATC curves upward
a. True b. False Indicate whether the statement is true or false
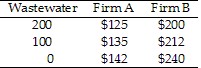
 Consider the data in Table 9.6. If each firm is currently generating 100 gallons of wastewater per day, Firm B would be willing to pay up to ________ to Firm A to be able to generate 200 gallons of wastewater per day.
A. $10 B. $12 C. $28 D. $200
Managerial reputation is an ________ incentive that helps to mitigate the ________ principal-agent problem.
A. internal; manager-consumer B. internal; manager-worker C. external; owner-manager D. external; owner-consumer