Graph the solution set of the inequality, where x is an integer, on the number line.3x ? -3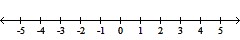
A. ![]()

B. ![]()

C. 
![]()
D. 
![]()
Answer: A
Mathematics
You might also like to view...
Assume that a sample of bivariate data yields the correlation coefficient, r, indicated. Use the critical values table for the specified sample size and level of significance to determine whether a linear correlation exists.r = 0.672 when n = 18 at ? = 0.05
A. Yes B. No
Mathematics
Simplify. 2
2
A. 
B. 
C. 
D. 
Mathematics
Find the square root.
A. 
B. 
C. 
D. 
Mathematics
Solve the inequality graphically.x2 + 8 ? -4x
A. (-?, -4) B. (8, ?) C. No solution D. (-?, ?)
Mathematics