Graph the system of linear inequalities.x > 2 and y ? -2
A. 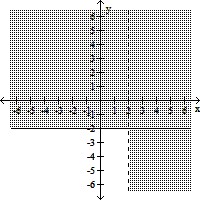
B. 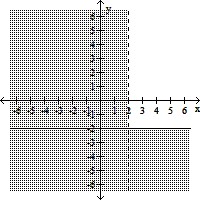
C. 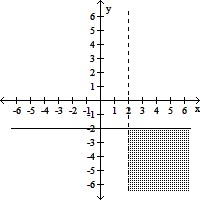
D. 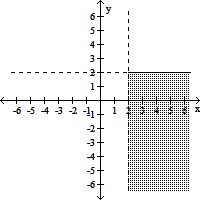
Answer: C
You might also like to view...
The box plots represent a comparison of the annual salaries of a group of opera and a group of country western singers respectively.
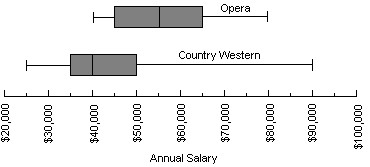 Which of the following represents the five number summary for the salaries of the opera singers?
A. Min = $20,000, Q1 = $40,000, Q2 = $55,000, Q3 = $80,000, Max = $100,000 B. Min = $0, Q1 = $40,000, Q2 = $45,000, Q3 = $55,000, Max = $65,000 C. Min = $40,000, Q1 = $45,000, Q2 = $55,000, Q3 = $65,000, Max = $80,000 D. Min = $45,000, Q1 = $55,000, Q2 = $55,000, Q3 = $55,000, Max = $65,000 E. none of these
If is a differentiable function, find an expression for the derivative of 
What will be an ideal response?
A new chocolate company is estimating how many candy bars per week college students will consume of their line of products. The graph shows the probable number of candy bars students (age 18-22) will consume from year 0 to year 10. B(x) gives the number of candy bars for boys, G(x) gives the number of candy bars for girls, and T(x) gives the total number for both groups. Use the graph to answer the question.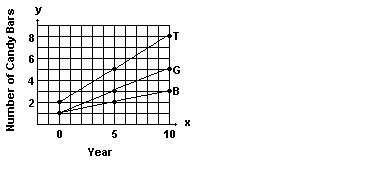 Estimate B(7) and G(7) and use your estimates to estimate T(7).
A. 2.3; 4.0; 6.3 B. 2.2; 4.3; 6.5 C. 3.5; 4.2; 7.7 D. 2.5; 4.0; 6.5
Divide and write the answer in simplest form.-98 ÷ (-7)
A. 
B. -14
C. 14
D. 4