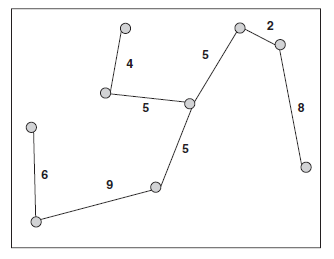
Find the nearest neighbor statistic for the following pattern, assuming a study area of 15 by 15 km. Test the null hypothesis that the pattern is random by finding the z statistic.

First we calculate the distances to the nearest neighbor for every point, and find that the distances are: 6, 6, 5, 5, 4, 4, 2, 2, 8. The mean of these values is 4.667, and with the area being 15 by 15, the density of points p is given by n/A = 9/225 = 0.04.
Thus, R = 2 * 4.667 * sqrt(0.04) = 1.867.
Next, we calculate V[R] = (4 - pi) / pi*n = (4 - pi) / pi*9 = 0.030.
From this
z = (R - 1) / sqrt(V[R]) = (1.867 - 1) / sqrt(0.030) = 4.974
This is greater than the critical value of 1.96, so that we reject the null hypothesis of no pattern. The data show strong evidence of uniformity.
You might also like to view...
Surrounding a moving electron is
A. an electric field. B. a magnetic field. C. both of these D. neither of these
Gyres in balance between the pressure gradient and the Coriolis effect are called ____________ gyres. Fill in the blank(s) with the appropriate word(s)
The large agricultural yields obtained today are fundamentally dependent upon fossil fuels. Indicate whether the statement is true or false
Based on shoreline deposits from 125,000 years ago, scientists believe that the sea will ________ before the next ice age
A) rise 5-6 meters B) rise 10-12 meters C) drop 1-2 meters D) drop 10-12 meters