Construct a probability model for the experiment.Spinner I has 4 sections of equal area, numbered 1, 2, 3, and 4. Spinner II has 3 sections of equal area, labeled Red, Yellow, and Green. Spinner III has 2 sections of equal area labeled A and B. Spin Spinner I, then Spinner II, then Spinner III. What is the probability of getting a 2, followed by Yellow or Green, followed by B?
What will be an ideal response?
S = {1 Red A, 1 Red B, 1 Yellow A, 1 Yellow B, 1 Green A, 1 Green B, 2 Red A, 2 Red B, 2 Yellow A, 2 Yellow B, 2 Green A, 2 Green B, 3 Red A, 3 Red B, 3 Yellow A, 3 Yellow B, 3 Green A, 3 Green B, 4 Red A, 4 Red B, 4 Yellow A, 4 Yellow B, 4 Green A, 4 Green B};
Each outcome has a probability of  .
.
The probability of getting a 2, followed by Yellow or Green, followed by B is 
You might also like to view...
A value of sinh x or cosh x is given. Use the definitions and the identity  to find the value of the other indicated hyperbolic function.sinh x = -
  , sech x =
A. 
B. - 
C. 
D. 
Determine the name of the polygon.
A. Octagon B. Pentagon C. Heptagon D. Triangle
Solve the problem.The bar graph shows the number of fatal vehicle crashes per 100 million miles driven for drivers of various age groups. 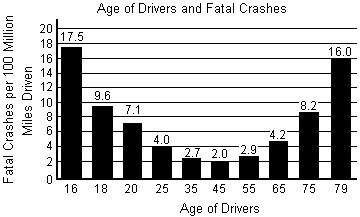 The number of fatal vehicle crashes per 100 million miles, N, for drivers of age x can be modeled by the formula N = 0.012x2 - 1.18x + 31.26.Using the formula, what age group(s) are expected to be involved in 4 fatal crashes per 100 million miles driven? Use a calculator and round to the nearest year. How well does the formula model the trend in the actual data shown in the bar graph?
A. 37 year-olds and 61 year-olds; The formula models the trend in the data reasonably well. B. 27 year-olds and 71 year-olds; The formula does not accurately model the data for ages expected to be involved in 4 fatal crashes per 100 million miles driven. C. 75 year-olds; The formula models the trend in the data reasonably well. D. 24 year-olds ; The formula does not accurately model the data for ages expected to be involved in 4 fatal crashes per 100 million miles driven.
Use positive rational exponents to rewrite the expression.
A. 6x5 B. 5x6 C. x5/6 D. x6/5