The following table shows the population N of a small town t years after 2000. Use linear regression to model the population as a function of years since 2000.
t 2 3 6 7 N 2852 3038 3703 3982
What will be an ideal response?

Mathematics
You might also like to view...
Shade the solution set to the system of inequalities.x + 2y ? 2x - y ? 0
A. 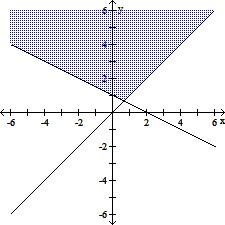
B. 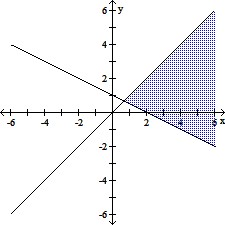
C. 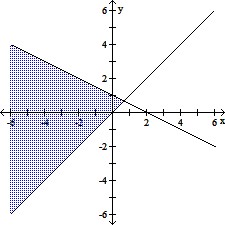
D. 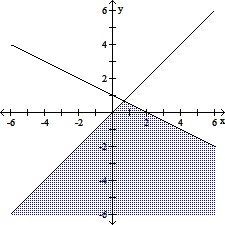
Mathematics
Multiply. Write the answer in simplest form. ?
? 
A. 
B. 
C. 
D. - 
Mathematics
Express the following in interval notation.-3 < x < 9
A. [-3, 9] B. (-?, -3) ? (9, ?) C. (-3, 9) D. (-?, -3] ? [9, ?)
Mathematics

Differentiate.
Mathematics