In Figure 5.8, if the supply curve moves from S2 to S4,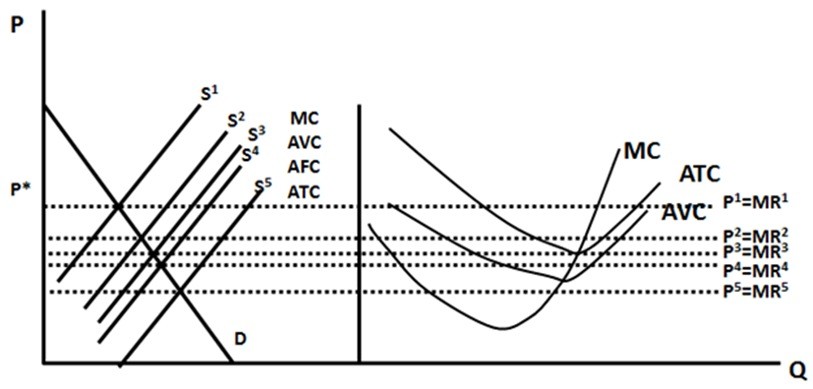
A. the firm will make a smaller economic profit than they used to.
B. the firm will go from making an economic profit to a loss but one that is not big enough to make it want to shutdown.
C. the firm will go from making an economic profit to a loss that is big enough to make it want to shutdown.
D. the firm will go from making an economic profit to a normal profit.
Answer: B
You might also like to view...
The figure above illustrates a linear demand curve. In the range from $8 to $6
A) the demand is price elastic. B) the demand is unit elastic. C) the demand is price inelastic. D) more information is needed to determine if the demand is price elastic, unit elastic, or inelastic.
Some years ago, the World Bank surveyed the ways in which countries encouraged or discouraged market activity. Its conclusion was
A. when poor people are allowed access to the institutions richer people enjoy, they are ill equipped to take advantage of those benefits. B. when poor people are allowed access to the institutions richer people enjoy, they can thrive and help themselves. C. that there was no measurable difference between the countries that actively encouraged market activity from those that discouraged it. D. without the proper resources, encouraging market activity had no effect.
Suppose a country has government expenditures of $3,500, taxes of $2,200, consumption of $9,000, exports of $2,500, imports of $2,700, transfer payments of $750, capital depreciation of $800, and investment of $3,000 . GDP equals
a. $24,450. b. $11,550. c. $15,300. d. $20,700.
For each dollar paid in taxes, approximately how much do households in the top quintile receive back in the form of government expenditures?
A. 12 cents. B. 28 cents. C. 41 cents. D. 73 cents.