A ____________ curve graphically shows the? trade-off that occurs when more of one output is obtained at the sacrifice of another. This curve is a graphical representation? of, among other? things, opportunity cost.
Fill in the blank(s) with the appropriate word(s).
production possibilities
You might also like to view...
As default risk increases, the expected return on corporate bonds ________, and the return becomes ________ uncertain, everything else held constant
A) increases; less B) increases; more C) decreases; less D) decreases; more
A nation's country-risk premium increases if:
a. Expected inflation becomes harder to predict. b. The average maturity structure in the nation rises. c. None of the above d. Central bank policies become more predictable. e. All of the above.
Using Figure 1 above, if the aggregate demand curve shifts from AD1 to AD2 the result in the short run would be: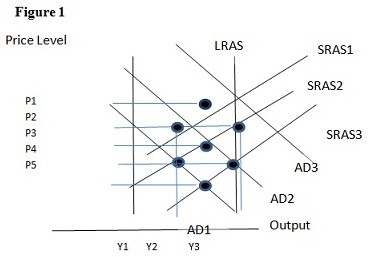
A. P1 and Y2. B. P3 and Y1. C. P2 and Y2. D. P2 and Y3.
The concept that "there is no free lunch" reflects the notion that:
a. the benefit of certain "free" goods only accrues to society. b. unlimited resources are used to produce so-called "free goods" that are given up in order to produce the aforesaid "free" goods. c. scarce resources are used to produce so-called "free goods" that have alternative uses that are given up. d. even if your friend pays for your lunch, you'll have to repay the favor at a later time.