Which of the following scenarios are illustrated in the give PPC? (check all that apply)
a. An economy in full employment along the curve
b. Unemployment at point W
c. Output combination C is better than the output combination B
d. Attainable combinations of both goods below the curve
a. An economy in full employment along the curve
d. Attainable combinations of both goods below the curve
You might also like to view...
Total utility can be calculated as the
a. difference between all marginal utilities b. price paid for one good c. sum of all marginal utilities d. total expenditure on all units of the good the consumer buys e. difference between the marginal utilities of the first and last units
The skills, training, and education possessed by workers that contribute to economic growth are known as
What will be an ideal response?
Use the following figure to answer the next question.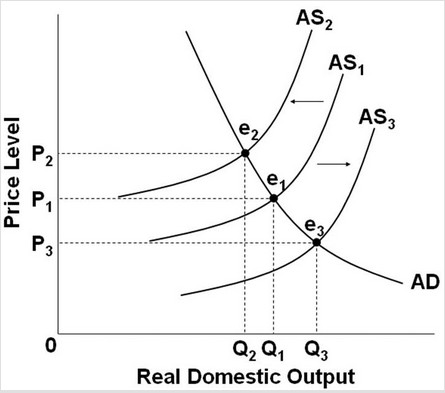 A shift from AS1 to AS2 would be consistent with what economic event in U.S. history?
A. Demand-pull inflation in the late 1960s B. Cost-push inflation in the mid-1970s C. Great Recession in 2007-2009 D. Full-employment in the late 1990s
For this question, assume that the there exists uncertainty about the impact of monetary policy on the macroeconomy. Given this information, it would be most appropriate for the central bank to increase money growth
A) at the midpoint of a recession. B) by more than the increase that will yield the desired response. C) by less than the increase that will yield the desired response. D) by an amount equal to the increase that will yield the desired response. E) only after it is certain that the economy has entered a recession.