The following triple line graph reflects the crime statistics gathered for a certain city. Use the graph to answer the following question(s).
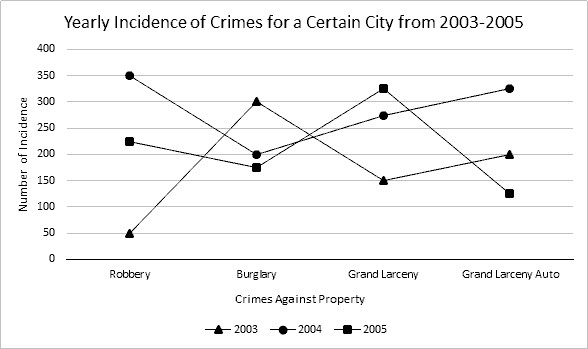 Which year was the number of robberies the highest and which year was it the lowest?
A. 2005 and 2004
B. 2004 and 2003
C. 2004 and 2005
D. 2003 and 2005
Answer: B
You might also like to view...
Use Stokes' Theorem to calculate the circulation of the field F around the curve C in the indicated direction.F = 3yi + yj + zk; C: the counterclockwise path around the boundary of the ellipse  +
+  = 1
= 1
A. 36? B. 12? C. -36 D. -36?
Provide an appropriate response.The initial population of a town is 121,473 and it grows with a doubling time of 55 years. What will the population be in 26 years?
A. 121,491 people B. 3,158,298 people C. 6,316,596 people D. 168,572 people
Find the inverse of the function.f(x) = 
A. f-1(x) = 
B. f-1(x) = (x - 1)2
C. f-1(x) = x2 + 1, x ? 0
D. Not a one-to-one function
Use inductive reasoning.Use inductive reasoning to predict the next term in the sequence of numbers.0, 3, 3, 0, -3, ?
A. 3 B. -3 C. 0 D. 6